The bad news: as a tourist destination, you compete with the whole world. The good news: positioned correctly, you are a potential destination for the whole world. The best news: with Tourism Insights, you have analytics at your fingertips to help you tap into that potential even more. Tourism Insights makes your guests and your region tangible. Dive in and learn more about your region and your guests: Where do my guests come from and how do they move through my region? Which places or events do they visit and how long do they stay there? What demographics does my region attract? For whom do I need to improve my offer? All this and much more, tailored to your questions and, like everything we do, anonymized and in compliance with the strictest data protection guidelines.
Who visits my region?
Analyze day tourists and overnight visitors in your region.
What is the arrival and departure behavior of the guests? Which sights are visited and how do they move around the region?
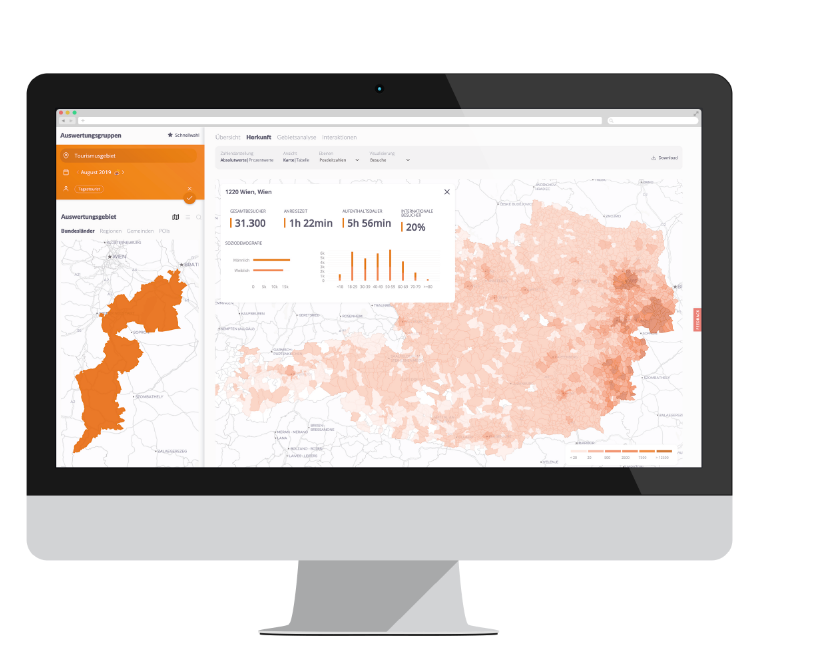
Where do my guests come from?
From which areas do your guests travel, what are the arrival and departure patterns, and how long are people traveling?
Where else do they go?
How do your guests interact with the surrounding regions? Which other locations do they visit? Put together packages tailored to the needs of your guests.
Your guests at a single glance
Immerse yourself in your region and get to know your guests anew in order to improve tourist offers, expand infrastructure and advertise in a more targeted manner.
As diverse as your region
From a diverse tourism region, to a state-of-the-art ski resort, to an idyllic Advent market – Tourism Insights adapts to your needs and questions. We provide exactly what you’re looking for, exactly how you need it. Be it interactive dashboards or bare numbers.
Daily
Surveys and polls of your guests take time. So much time that the results are outdated before they are even available.
With Tourism Insights, you get new insights into your region every day. So you can identify trends, react to changes and plan for the future.
Comprehensive
Extensive Day trippers and private overnight visitors are not recorded at all.
Tourism Insights offers you a view of the whole. All guests. All relevant locations. All movement patterns. Every day of the year.
Flexible
Every region is different. Tourism Insights has the right answer for every question.
Strong data. Strong regions.
Tourism regions that already benefit from our analyses:
„
“Thanks to the A1 solution, we receive constant information as well as reliable, resilient figures on our guests. That’s particularly important in Corona times, of course.”
Dipl.-Kfm. Stephan Köhl
Managing Director Tourism Association Bad Ischl
Tourism regions that benefit from our analyses
Contact us!
You would like to learn more about our products and solutions, or have further questions? We look forward to hearing from you and will be happy to answer your inquiry.