Analyze at different geographic levels. From 500 x 500 grids, to GeoHash 5 and 7, municipalities and postal codes, to individual areas and regions.
Data is worth a
thousand words
In positions of responsibility, you make countless decisions every day. Decisions that significantly influence the success of your company, the quality of life in your city or the future of your region.
With Invenium Data Analytics Solutions, the full analytical power of Invenium is at your fingertips. Leverage our knowledge of human mobility, link it to your own systems and data, and transform the way you make decisions.
Analyses to go
Answers to the basic questions of human mobility prepared as analysis packages for your sites. Where do people spend their time? Where do my visitors come from? Where do they go? … All our know-how for your questions as data export or API.

DATA ANALYTICS SOLUTIONS
Answers to your questions
With which areas do I relate?
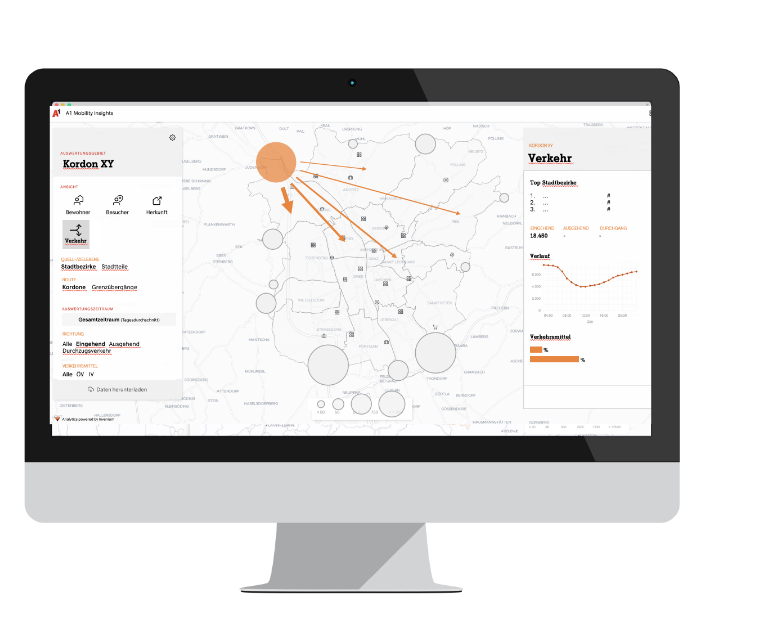
Explore traffic relationships between sources and destinations of your visitors in matrix form and identify frequent routes. Depending on the question, the first or previous stay is available as the source cell and the last or subsequent stay as the destination cell.

What is the potential of my location?
Use frequency numbers around your locations to identify most popular times of day or seasonal differences, estimate the impact of events or construction, or determine the skim rate at your locations.

Who is staying at my location?
Quantify the popularity of your site through count data on your visitors, residents, or guests, and get to know your target audience anew by filtering for socio-demographic characteristics, nationalities, and place of origin in the country of evaluation.

How do people move through my area?
How do people move through your area? Where do they stay? What other destinations do visitors to an area visit? Our movement chain analyses answer this and much more.

Which people do I reach?
Where do your visitors come from? Use information on visitor origins, travel distances and arrival times to set region-specific measures and review measures that have been set.
CONFIGURATIONS
Customized analyses
Get analyses for time periods such as days, weeks, months, quarters, years, individual days of the week or individual periods broken down by hours, times of day or days.
Get to know your target group
get to know them anew and analyze their places of origin, whereabouts, nationality and socio-demographics.

Individual questions.
Customized solutions.
Customers who are already benefiting from our analyses:

Contact us!
You would like to learn more about our products and solutions, or have further questions? We look forward to hearing from you and will be happy to answer your inquiry.


